 Energy Management System
PDF
Energy Management System
PDF
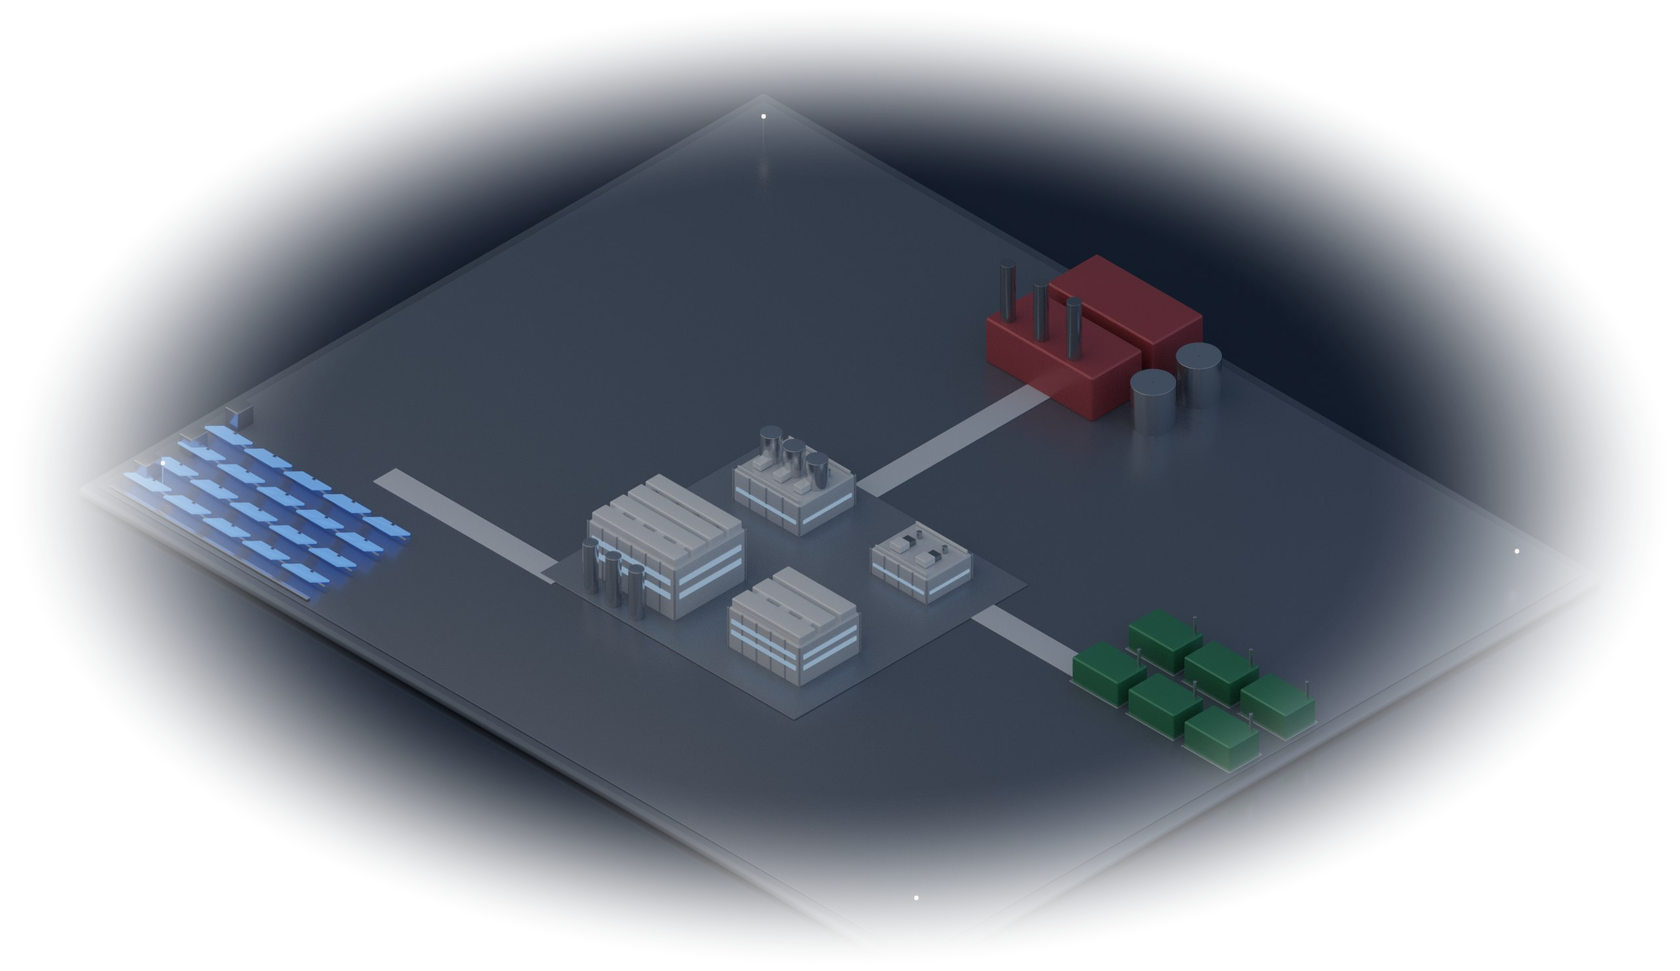
Apex watches your generators, solar, utilities and production lines at once. It shows you what's running, what it costs, and where money is slipping away.

Every generator, inverter, compressor and chiller comes with its own controller and its own little screen. The numbers exist, but pulling them together takes a spreadsheet and half a morning.
The plant keeps its own copy of everything, so a bad internet day doesn't cost you any data. The cloud does the heavy lifting: history, calculations, alarms and the dashboards you open.
PLCs, inverters, genset controllers and meters. Nothing gets replaced.
Reads every device over Modbus, about every 10 seconds.
Stores everything locally and keeps running if the link drops.
Years of history, checked totals, alarms, forecasts and AI.
Browser, phone, and a PDF in your inbox each morning.
The connection is encrypted and starts from the plant. Nothing on the internet can reach in.
Readings wait on the edge server and catch up on their own when the internet comes back.
Watchdogs check the link every few minutes and restart anything that stalls. Backups run nightly, off-site too.
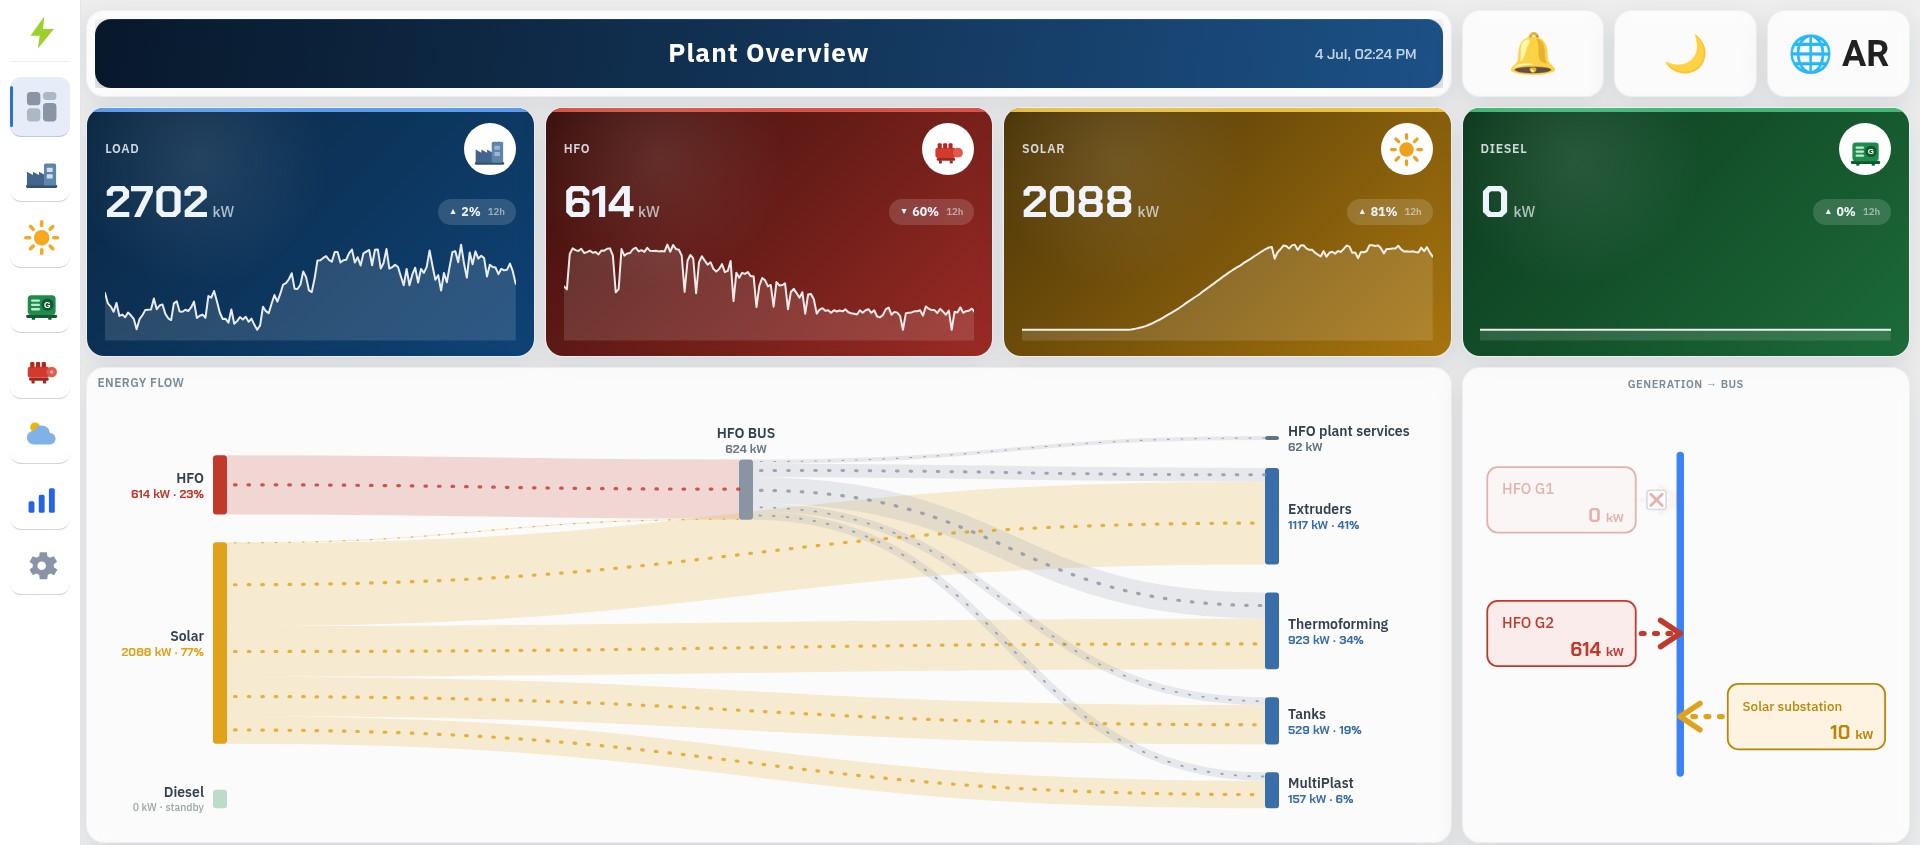
Load, HFO, solar and diesel side by side, with the last 12 hours sketched under each number.
Follow each kilowatt from its source to the hall that uses it. The lines move with the plant.
Each production hall, with its share of the total and the source feeding it.
Which HFO engine is carrying the bus right now, and how much solar is feeding in.
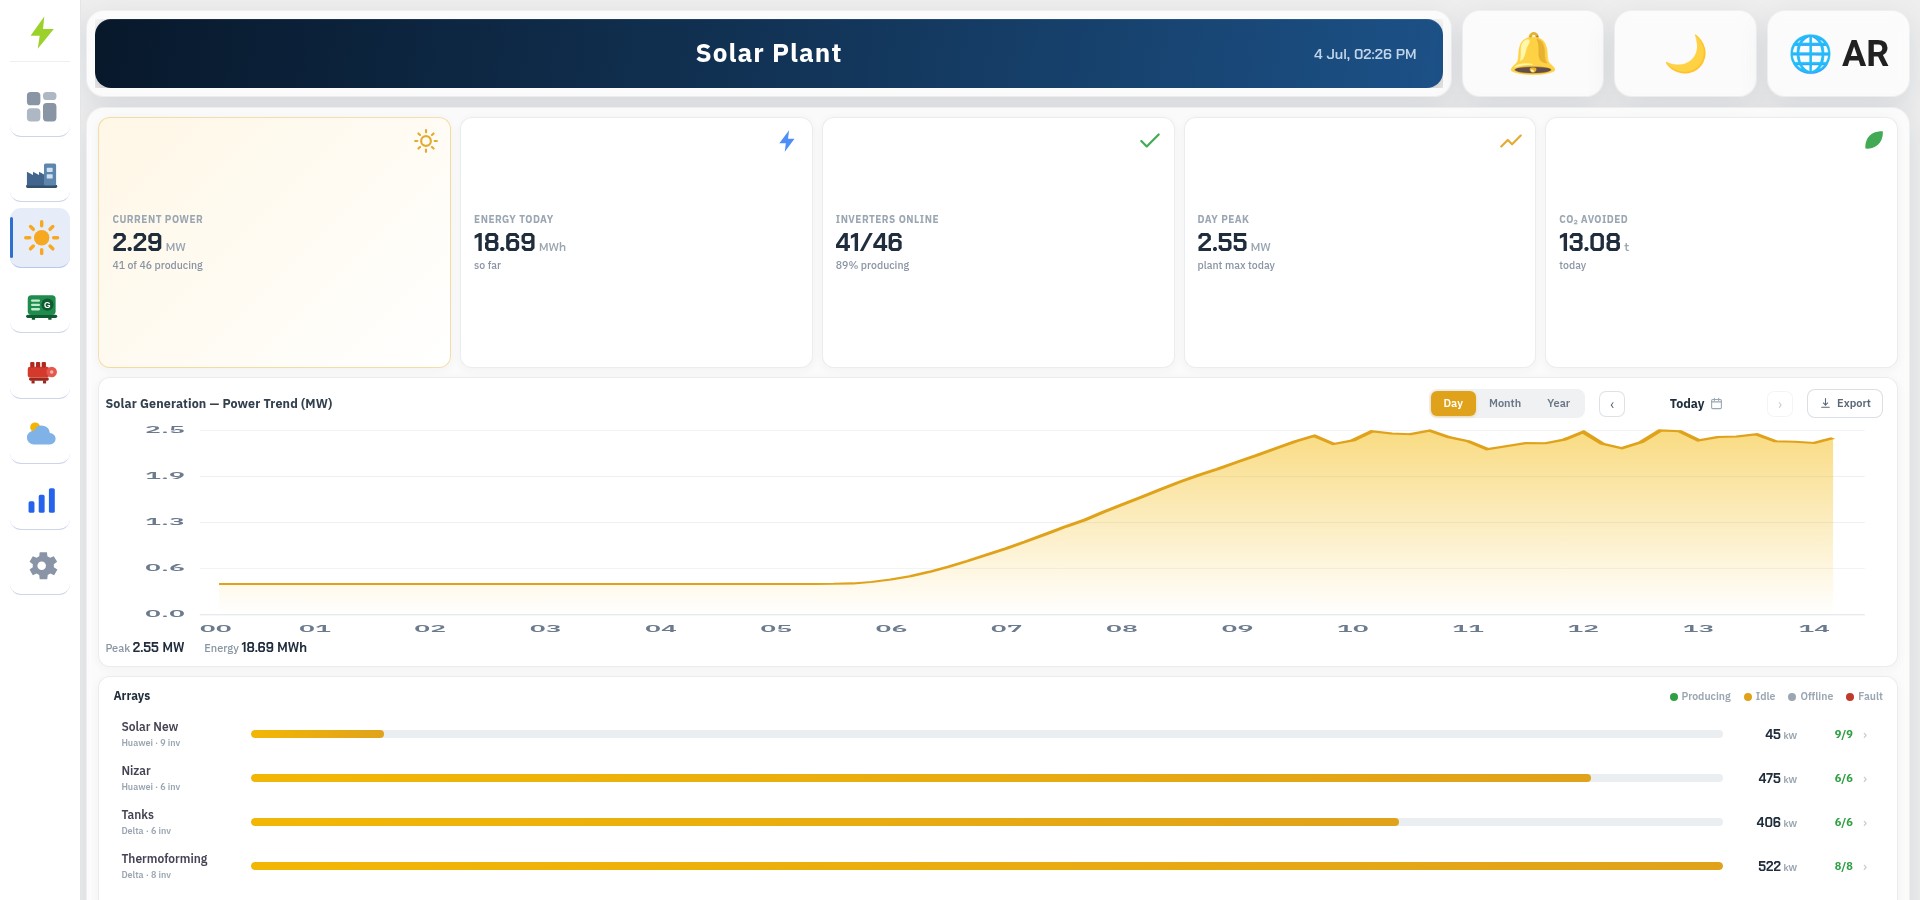
Output right now, energy so far, the day's peak and the CO₂ you didn't burn.
"41 of 46" tells you straight away that five units need a look.
Flip back through the production curve and export it to Excel in one click.
Each array's output and online count. Click through to the single inverter.
An inverter's total output hides a lot. Measure each string separately and compare it with its neighbours at the same moment. They see the same sun and the same heat, so any gap is down to the string itself.
Two checks run all day, on every inverter and every array. Together they tell you not just that output is low, but why.
Each inverter reports the DC power coming in from the panels and the AC power it sends out. Apex divides one by the other every few minutes. Healthy units hold steady around 97 to 98%.
A weather station on site measures sunlight, temperature and wind. Each array is calibrated against its own best recent days, so Apex knows what it should be producing right now and compares that with what it is producing.
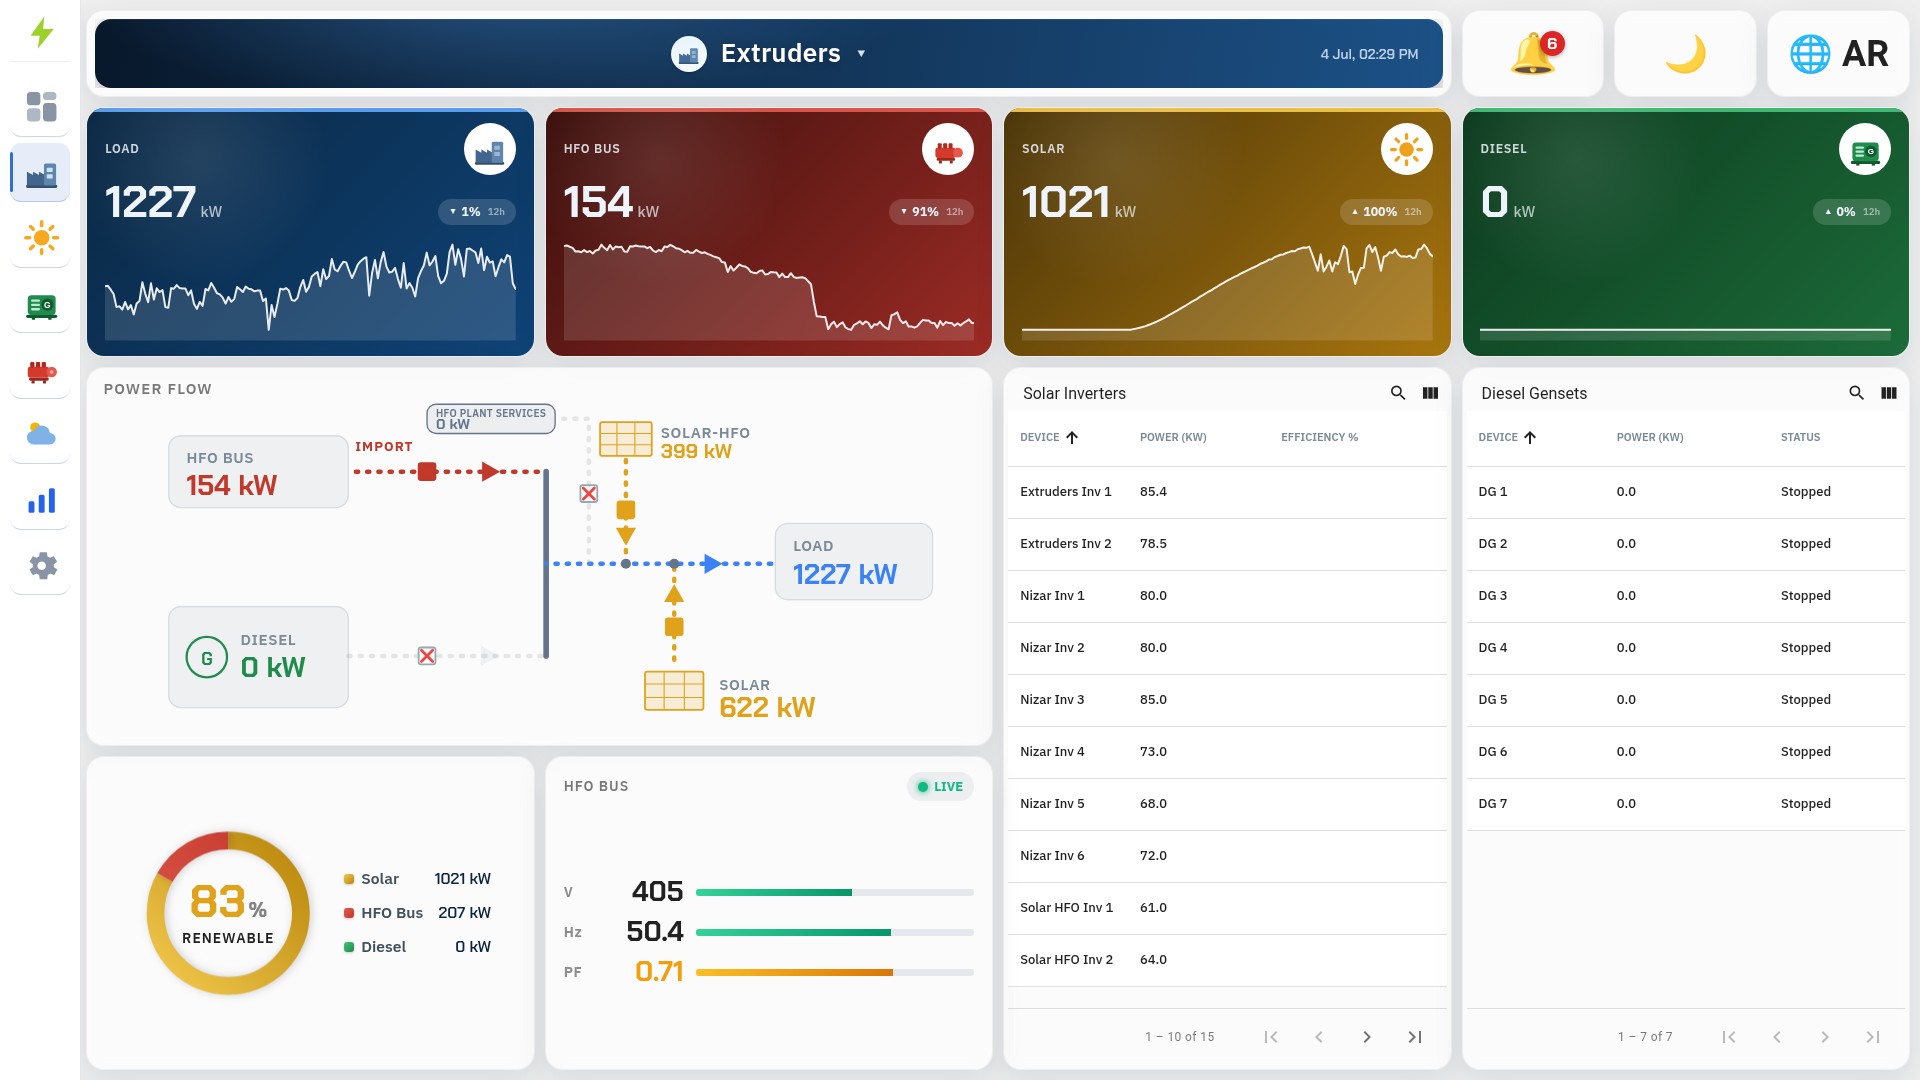
HFO import, solar and diesel meeting the hall's load. Open breakers are marked.
The share of the hall's power coming from solar at this moment.
Voltage, frequency and power factor on the bus. Low PF shows up in orange before it becomes a bill.
Each inverter's output and each diesel genset's state, running or stopped.
One meter tells you how much a machine uses. Put one on the way in and one on the way out, and you know how well it's working. That ratio is its efficiency, and it's the number worth watching.
Each machine gets a baseline: how it performs when it's healthy, at a given load. Apex compares every day against it. A slow drift is the early warning, usually weeks before anything breaks.
| Machine | What drifts | What it usually means |
|---|---|---|
| Generator | More fuel per kWh, hotter exhaust | Injectors, air filters, turbocharger |
| Compressor | More kW per m³, more air at night | Clogged intake filter, worn element, leaks |
| Chiller | COP falling, condenser running hot | Fouled tubes, low refrigerant charge |
| Boiler | Efficiency down, stack temperature up | Soot or scale on the tubes, burner out of tune |
Service by real running hours, starts and energy delivered, not by the calendar. Busy machines get attention sooner. Idle ones don't get serviced for nothing.
Book the job when the trend says so, at a time that suits production, instead of waiting for a breakdown to make the decision for you.
Inverter faults and dropouts, supply voltage per hall, genset starter batteries, and any efficiency that drifts past its limit. Each alarm clears itself once the problem is gone.
Conditions have to hold for a while before anything fires, so a passing cloud or a single bad reading won't wake anyone up.
A frozen or silent meter is left out of the totals rather than quietly padding them. Each hall's load is checked against its sources, and they add up.
Pick a day to see how power moved through it, or a month to compare every day side by side. Cost, solar savings, fuel efficiency and CO₂ are already worked out.
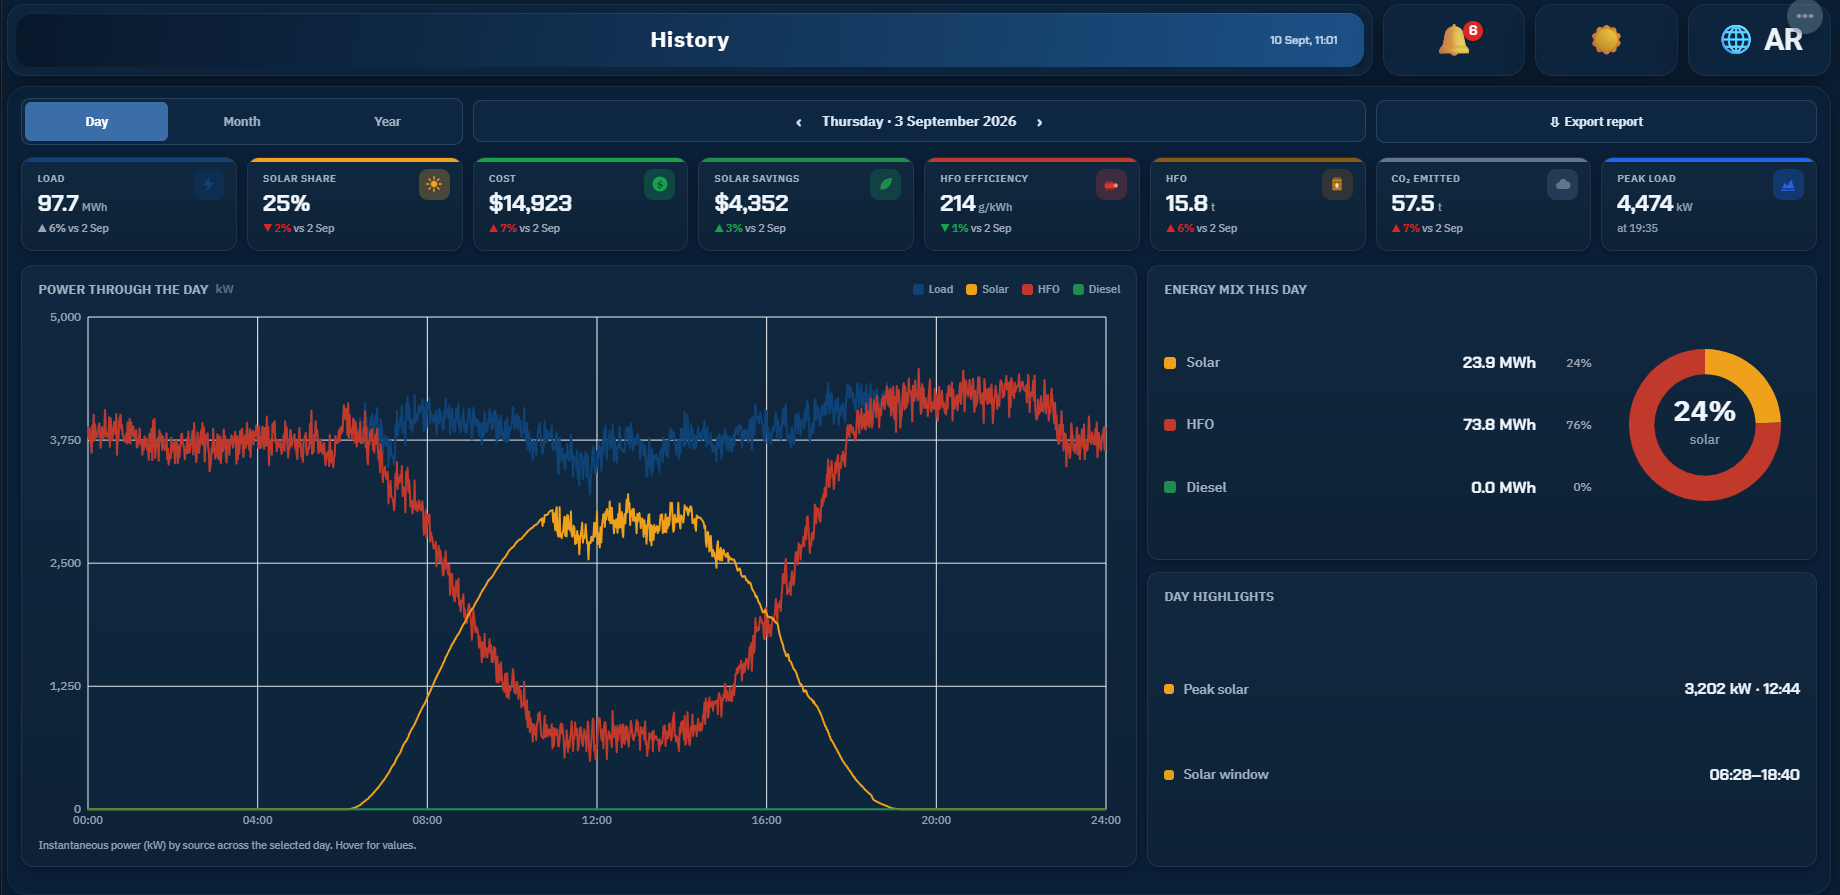
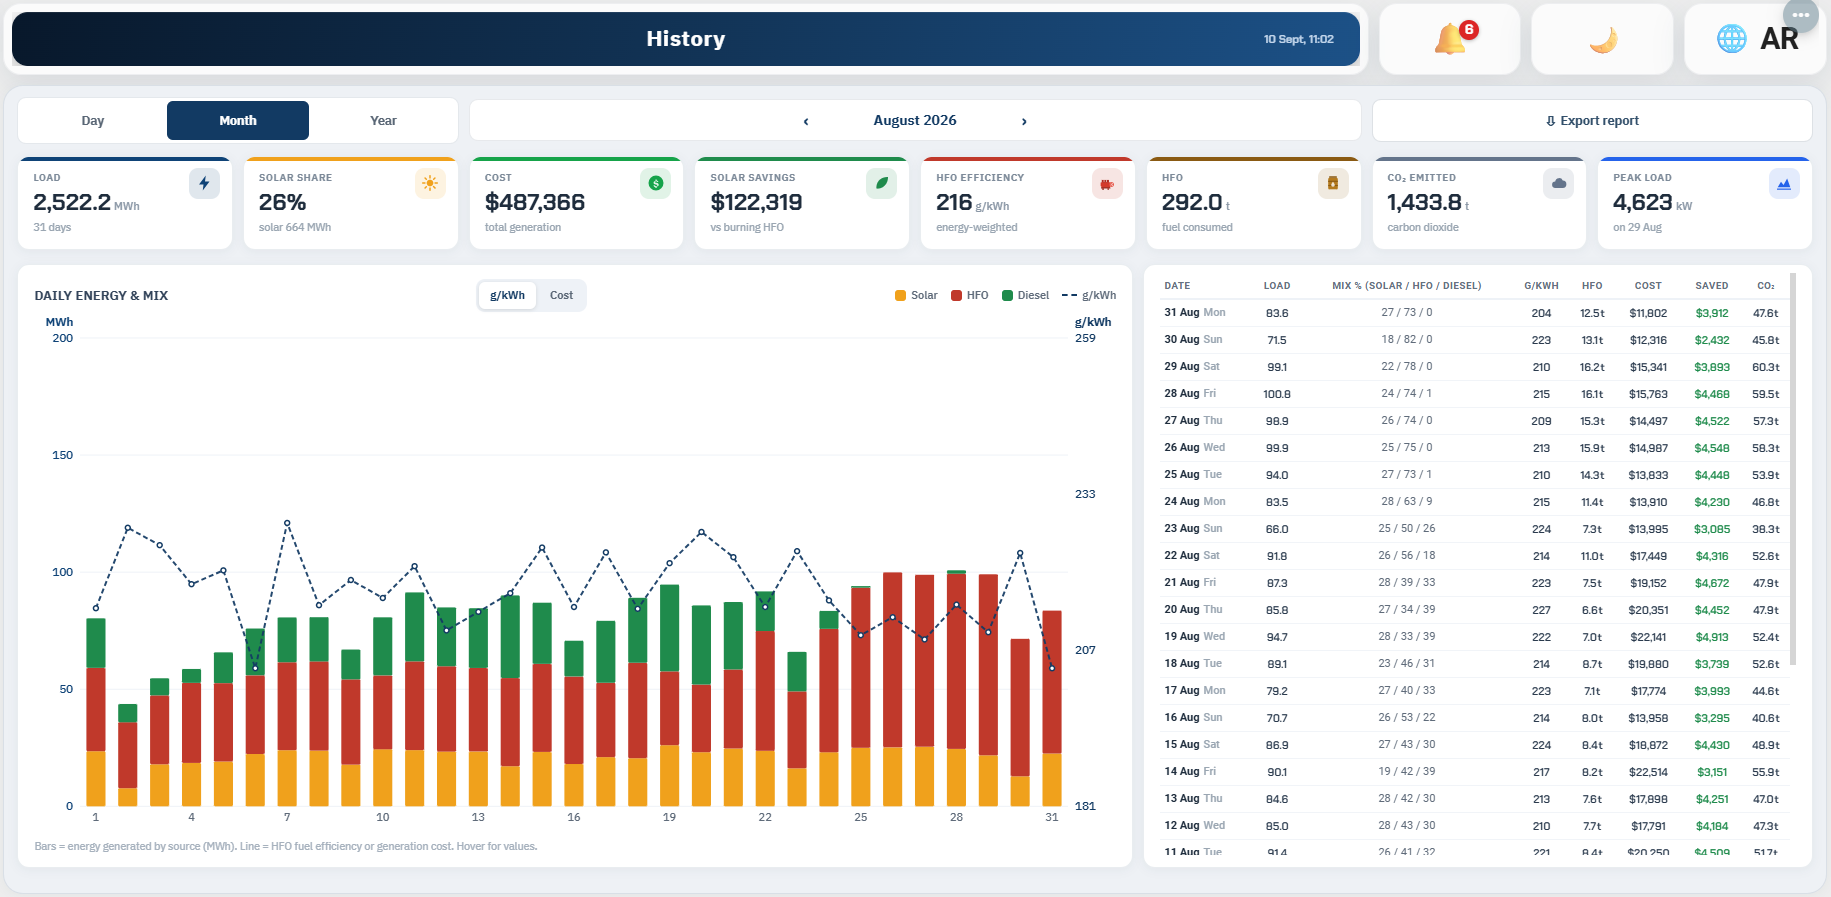
| HFO engine 1 | 21.9 MWh | 212 g/kWh |
| HFO engine 2 | 20.8 MWh | 219 g/kWh |
| Diesel bank | 0.0 MWh | standby |
Just after midnight the system puts the day on one page and emails it to whoever needs it. Nobody has to remember to run it, and nobody has to build it in Excel.
A chat assistant built into the dashboard. Ask about any figure, machine or alarm in plain English or Arabic. It looks the answer up in the plant's own records and does the maths before it replies.
Every figure is looked up and calculated, not guessed or made up.
Machines, meters, alarms and the full history.
It can read everything, but it can't change a setting or switch anything.
Its own tab in the dashboard, on a desktop or a phone.
Weather forecasts, a sky camera and weather station on site, and the plant's own history. By early afternoon the end-of-day estimate is typically within about 2%.
The second HFO engine tends to stay on too long after the morning solar ramp and start too early in the evening. The advisor flags those windows. On June and July data, better timing works out to roughly $1,600 to $2,200 a month in fuel.
When solar would push the HFO engines below their safe minimum, it works out how much solar to hold back, plant by plant.
Both advisors only recommend. The operator makes the call, and nothing is switched without them.
Alarms and a short morning summary go straight to the phone people already use, WhatsApp first. Everyone picks what they receive, and when.
Pick by site, by machine and by severity. The maintenance lead gets the gensets, the owner gets the summary.
Warnings wait until morning. Faults that can't wait still come through at night.
If an alarm isn't acknowledged within a set time, it moves on to the next person on the list.
Acknowledge from the message, or jump straight to the right page in the dashboard.
Repeats are grouped and alarms that flicker on and off are held back.
Yesterday's energy, cost and open issues in one message, every day at 7:00.
Apex runs as an app on the office PC, the tablet on the shop floor and the phone in your pocket. Same live plant everywhere, laid out to suit each screen.
Plant Overview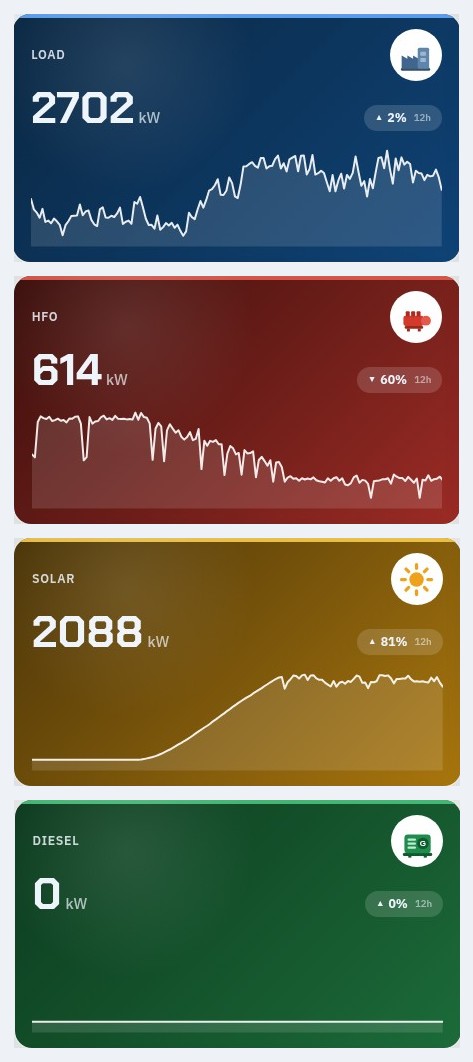
One installer and it's done. Opens straight onto your plant, full screen, ideal for a control-room display.
Major alarms arrive as push notifications, with a count on the app icon. The app tells you when an update is ready.
Add it to the home screen from Safari and it opens full screen, just like an app.
apexenergycloud.com, with nothing to install. Handy for a quick look from any computer.
A group with several factories, farms or branches gets them all under one login. See the whole group at a glance, or open any site on its own.
| Site, ranked by energy per ton | Load (MWh) | Solar | kWh/ton | Alarms |
|---|---|---|---|---|
1 Plant APlastics | 97.7 | 25% | 412 | 0 |
2 Plant BFood processing | 38.2 | 18% | 455 | 0 |
3 Plant CPackaging | 21.6 | 34% | 498 | 2 |
4 Plant DMetal works | 55.0 | 12% | 561 | 1 |
Switch between sites from a menu. Each keeps its own dashboards, alarms and reports.
Energy, cost and CO₂ added up across the group, with each site's share.
Per ton produced or per kWp of solar, so a big site and a small one sit on the same scale.
A site manager sees their own site. Head office sees them all. Set per person.
A new site copies the standard setup: dashboards, alarms and reports. Up and running in days.
Alarms from every site in one place, each labelled with its site, sent to the right people.
Apex already runs a working industrial plant, every day. Here's what's live now, and what we're building next.
See it live at apexenergycloud.com